

Describe Lean Six Sigma Fishbone Tool

Lean Six Sigma is so exciting and filled with curiosity because of the simple fact that it uses and utilizes various ways and methods of arriving at a particular solution. There are masses of different strategies and techniques you can try and do in order for you to get to the bottom of the problem – and one of those tools is none other than the Fishbone Tool or Diagram.
Today, we are going to discuss what the Fishbone Tool is and how it can be an effective way to clear out all the unanswered questions and concerns your company or your organization has.
Understanding the Fishbone Tool
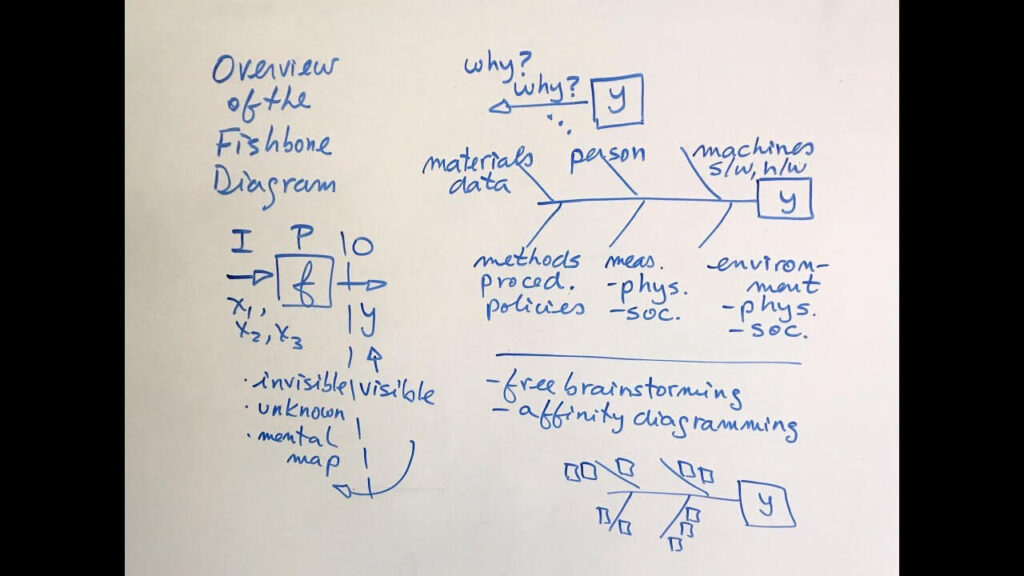
The Fishbone Tool, also known as the Ishikawa Diagram or the Cause and Effect (C&E) Diagram, is so effective to the extent that it is considered and known as one of the seven (7) of the best and the most effective quality tools. It’s dubbed as the Fishbone Diagram because once it’s laid out properly and appropriately, it takes the shape of a fishbone – with the categories on the largest area, narrowing down to the specific points and factors.
Decades-old, and still considered as one of the most relevant tools; the diagram or the tool utilizes a form of a fishbone to detail out and figure the cause and effect that would help managers and executives trace and break down problems and negativities involved in a company – even a particular department or division. The fishbone Tool is used to:
- Look at inconsistencies in business processes
- Identify and reduce waste and variation
- Predict failures, defects, and errors
- Plan a company’s risk management plan
Those aren’t the only things it can do, it is also used by businesses and organizations to map out how they want their processes and operations go so they wouldn’t care much about it.
Constructing a Fishbone Tool
So much on how to describe the Lean Six Sigma Fishbone Tool, what are the best ways how you can construct one? It’s not as hard and as complicated as many of you think. Whatever the business sector or industry you are in, the Fishbone Diagram can be the best and the most effective tool you can use
Problem Statement
The first step of every known methodology – you need to figure out what the problem is first. By doing so, you’re going to make things a lot easier. Once the problem statement is identified, write it down and enclose it in a circle or a box. Then, you would want to draw a straight horizontal line from the left running to it – put an arrow on the end of it at the right side.
Main Categories
Now that you have the main thing taken care of, it’s not time to draw and draft up categories of the problems. For example, if your problem is that a particular phase of your manufacturing process is not meeting demand, you can use the following categories:
- Machine Efficiency
- Your People or Staff Members (Manpower)
- Processes
- Maintenance
- Environment
Once you figure out the categories, write it down running along the horizontal line but not close – maybe a few inches away from it would do.
Causes of Problems
Under the category, list down the possible causes of the problems. For instance, in the people or manpower, you can write and include something in the likes of attendance, performance, improper skill or training, and the like. You will be able to figure that out if you dig deeper into the problems that your business or your organization is dealing with.
Sub-Topics of Problems
Last but most definitely not the least would be the sub-topic of these problems. Your problems aren’t stagnant and they are not, in any way, alone. For sure, all the causes have other things conspiring, making it worse than it is for your business or for your company. Try to find these and you will get to the bottom of your problem fast and effectively.
Describing the Lean Six Sigma Fishbone Tool is an easy task – applying it is the harder, more complicated part. No matter how well or how detailed you think your diagram is, you wouldn’t be able to perfect it easily.
This is where we here at Lean Six Sigma Curriculum Experts come in. Our organization has been standing strong for years and we never failed any of our clients. The expertise and the overall experience we have in the industry allowed us to be the best and the top organization, helping out businesses solve problems through Lean Six Sigma.
Learning the Fishbone Tool or Diagram
In our Lean Six Sigma Green Belt Training & Certification, we give an in-depth lesson on how businesses and organizations like you can take advantage of the Fishbone Diagram to get what you want and what you need. The structure of our training and our education is deemed as the best, not only because of the experience of our people but the results it yielded.
Whether you are in dire need of help and assistance on how you can construct the Fishbone Tool or Diagram, or if you require further and deeper lessons on Business Process Improvement, there’s no better and more skilled organization to help you but for us here at Lean Six Sigma Curriculum Experts.
Through the constant development and innovation we have dedicated, you will never feel a shortage of skill and knowledge. Talk to us and contact us – wherever you are, we can give you the guarantee that we are just one call or one email away.
If you think you need the help of a well-renowned and worldly-recognized Lean Six Sigma Instructor, Lean Six Sigma Curriculum Experts is an email or a call away. Talk to us today and get the help and the assistance you need tomorrow! It doesn’t matter where you are – we offer Virtual Lean Six Sigma Yellow Belt and Green Belt Training & Certification!
Over 2,000 companies and businesses have trusted us and our people – you can do so, too!
Below are our list of additional services:
Click On the Map to Find the Closest Lean Six Sigma Curriculum Experts Near You
